Building a unified vision: using AWS for Single Pane of Glass (SPoG)
In today's data-driven world, staying ahead of the curve requires clear, consolidated insights across your entire organization. The "single pane of glass" (SPoG) concept offers a holistic view of your business metrics, KPIs, and trends in a unified platform. This level of transparency empowers informed decision-making, fosters collaboration, and drives agility. This blog dives deep into how Amazon QuickSight, a powerful cloud-based Business Intelligence (BI) service, can be your key to building a robust SPOG analytics environment. We'll explore its capabilities and showcase impactful use cases, equipping you with the knowledge to craft your unified intelligence dashboard.
Demystifying the "Single Pane of Glass"
The single pane of glass is also known as insights or a transformation dashboard. It offers a bird’s-eye view, which provides org-wide visibility into the transformation journey via key metrics like release statuses, milestone dates, dependencies, pending approvals, test results, progress, environments, and teams involved. It aggregates data from different sources into a single dashboard. It is a valuable approach for modern businesses relying on technology and data to optimize performance, security, and innovation.
It can bring high transparency into customers’ engineering practices and processes through metrics and dashboards to help drive standardization and continuous engineering improvements.
How can SPoG benefit organizations?
- Simplifies the management of complex systems and environments by providing a single point of access and control for various aspects of the system.
- Improves the visibility and transparency of the system by displaying relevant data and information clearly and concisely.
- Enhances the collaboration and communication among different stakeholders by enabling them to share and access the same system view.
- Increases the efficiency and productivity of the system by reducing the need to switch between multiple tools or applications and automating and optimizing some tasks and workflows.
- Boosts productivity by reducing the need for manual tasks and switching between different tools.
- Enhances the user experience and satisfaction by providing a consistent and intuitive interface for accessing various services and functions.
- Facilitates collaboration and communication among stakeholders by enabling data sharing and feedback mechanisms.
While there are several benefits associated with SPoG, there are a few implementation challenges that need to be taken into consideration.
- Data integration and aggregation: A SPOG requires collecting and connecting data from various sources and tools, such as cloud platforms, on-prem systems, applications, databases, logs, metrics, traces, etc. This poses technical difficulties regarding data compatibility, consistency, quality, reliability, and cost.
- Data analysis and visualization: A SPOG also requires analyzing and visualizing the data in a meaningful and actionable way. This involves filtering, correlating and contextualizing the data to provide relevant insights and alerts, and designing and customizing the dashboard to display the data clearly and concisely. It also requires constant updating and maintenance to keep up with the changes and demands of the system.
- Data security and governance: It is also essential to ensure data security and governance.
Implementing a SPOG can be a challenging yet rewarding experience. One can navigate these challenges and achieve SPOG success using Amazon QuickSight.
Amazon quickSight is the perfect canvas for SPOG
Amazon QuickSight is a fully managed, cloud-native business intelligence (BI) service that helps create and share interactive dashboards and visualizations. It analyzes data from various sources, such as Amazon S3, Amazon Redshift, and Amazon RDS. Additionally, it can use connectors or APIs to connect to external data sources. It lets you:
- Seamlessly connect to many data sources, fostering integration with popular databases, cloud storage platforms, and custom data sources.
- Build stunning dashboards and visualizations using simple drag-and-drop functionality.
- Improve collaboration with colleagues and stakeholders by facilitating easy sharing of insights using dashboards and reports.
- Dive deeper with ad-hoc analysis, allowing one to go beyond the surface with powerful filtering and drill-down capabilities.
It also empowers you to gain deeper insights and make smarter decisions, as it offers:
- Real-time analytics: Monitor key metrics and track trends as they happen, giving the agility to react quickly to changing market conditions.
- Machine learning insights: Leverage the power of machine learning to uncover hidden patterns and predict future outcomes.
- Built-in algorithms: Implement the algorithms to identify anomalies, forecast trends, and optimize your operations.
- Embedded analytics: Make data-driven decisions at the point of need without switching between tools.
So, whether you are a seasoned data analyst or a business owner, it has something to offer. Its intuitive interface, powerful features, and seamless integration with other AWS services make it the perfect solution for anyone looking to gain a competitive edge through data-driven insights.
Unifying devOps data for enhanced visibility
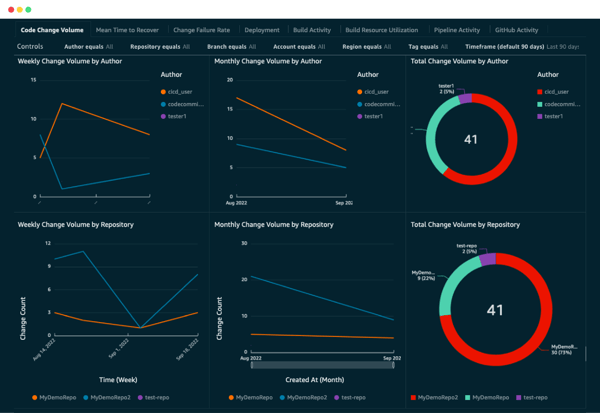
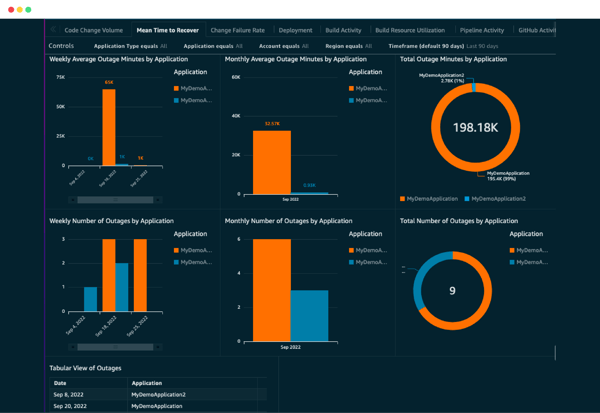
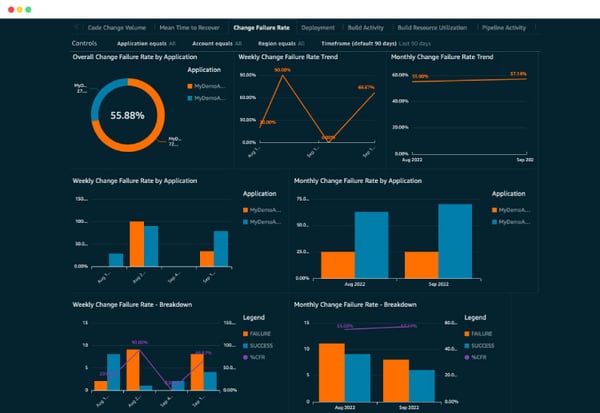
QuickSight seamlessly integrates with various DevOps tools and data sources, including AWS services like CloudWatch, CodePipeline, CodeBuild, X-Ray, and third-party tools like Jira, GitHub, and Jenkins, to name a few. It can help bring critical DevOps metrics under one roof, such as DORA metrics, Build and Test success rates, and Code quality indicators.


Amazon QuickSight helps create tailored dashboards for specific DevOps use cases, like:
Monitoring application performance: Track key performance indicators (KPIs), including response times, error rates, and throughput. Visualize trends and anomalies to identify bottlenecks and optimize performance quickly.
Visualizing application performance metrics: Track deployment pipelines, monitor the progress of deployments across environments, and identify bottlenecks and delays in the deployment process.
Managing incident response: Visualize alerts and incident data for faster triage and resolution, track MTTR, and identify areas for improvement in incident management processes.
Optimizing resource utilization: Track resource usage (CPU, memory, storage) across infrastructure and applications, and identify underutilized or overprovisioned resources to optimize costs and performance.
Enhancing collaboration and decision-making: Share insights for better team alignment and collaboration. Provide a unified view of DevOps data, empowering teams to make informed decisions based on real-time data insights for continuously improving processes and outcomes.
How quicksight addresses common SPoG hurdles
Breaking down data silos
- Extensive data source connectivity: Seamlessly connects to AWS services, databases, SaaS applications, and flat files.
- Powerful data blending: Combines data from multiple sources, even with different schemas, to create unified views and uncover hidden insights.
- SPICE for accelerated performance: Leverages Super-fast, Parallel, In-memory Calculation Engine (SPICE) for lightning-fast data processing and querying.
Unifying disparate systems
- Centralized dashboard experience: Build comprehensive dashboards incorporating data from various sources, providing a unified view across multiple systems using drag-and-drop functionality.
- Embed analytics for seamless integration: Embed dashboards directly into your existing applications and portals using APIs.
- Role-based access controls (RBAC): Define granular access permissions to ensure users only see the data they're authorized to view.
Fostering user adoption
- A user-friendly interface makes it easy for anyone to create and interact with visualizations,even without extensive data analysis experience, thereby fostering adoption.
- Interactive exploration and storytelling engage users with interactive dashboards offering seamless data exploration.
- Collaboration and sharing features empower teams to share insights and collaborate effectively through shared dashboards,annotations, and comments.
By leveraging QuickSight's capabilities, you can effectively address common SPoG implementation challenges, accelerate time-to-value, and realize the benefits. While ensuring data security with AWS's robust security infrastructure and compliance capabilities, it can also scale seamlessly to accommodate growing data volumes and user needs.
Delving into advanced technical configurations in quicksight
- Quicksight uses a robust in-memory engine, SPICE, that automatically optimizes data for analysis and stores it in a secure and encrypted environment.
- Use Custom SQL queries to extract specific insights and create tailored visualizations.
- Utilize parameters and filters to enable dynamic,interactive dashboards and allow users to personalize views and drill down into specific data slices.
- Enable geospatial visualizations to display location-based data on maps to track global infrastructure deployments,visualize user distribution, and analyze regional trends.
Leveraging other AWS native services for a powerful SPoG
If you are looking for a low-cost solution, AWS also offers comprehensive suite of services for building a robust SPoG tailored for DevOps. This solution will be a custom SPoG platform when compared to QuickSight. Let's delve into the integration of Amazon Managed Grafana, Kafka and Lambda to create a cohesive and dynamic SPoG platform.
- Amazon managed grafana: The visualization powerhouse
Teams can create intuitive dashboards displaying key performance indicators, infrastructure health, and application metrics by connecting AWS Managed Grafana to metrics and logs from services like CloudWatch. - Amazon kafka streaming: Real-time data processing
DevOps thrives on real-time data, and AWS Kafka streaming enables the ingestion and processing of massive volumes of data in real time. - Amazon lambda: Serverless automation
AWS Lambda facilitates code execution in response to events, and its serverless architecture aligns seamlessly with the DevOps philosophy. - Security and compliance
Implement AWS Identity and Access Management (IAM) policies to control access to the SPoG components.
Final thoughts
The dynamic SPoG enhances visibility and empowers teams to embrace a culture of continuous improvement and innovation. Implementing a Single Pane of Glass (SPoG) with Amazon QuickSight empowers organizations to make data-driven decisions, foster collaboration, and unlock new levels of agility. In addition, customized SPOG can be created by integrating Amazon Managed Grafana, Kafka Streaming, Timeseries DB, and Lambda. These native services provide a powerful foundation for building a SPOG tailored platform for DevOps transformation. Embrace the AWS native advantage and pave the way for a more efficient and collaborative DevOps journey.


.png?width=1920&height=1080&name=Consulting2_Menu_1%20(1).png)


.png?width=60&height=60&name=Vinay-Kumar-Build-a-Unified-Vision%20(1).png)


.webp?width=400&height=400&name=The%20future%20of%20Healthcare%20(1).webp)


.png?width=400&height=400&name=7-Jun-13-2025-02-27-19-6568-PM%20(1).png)


